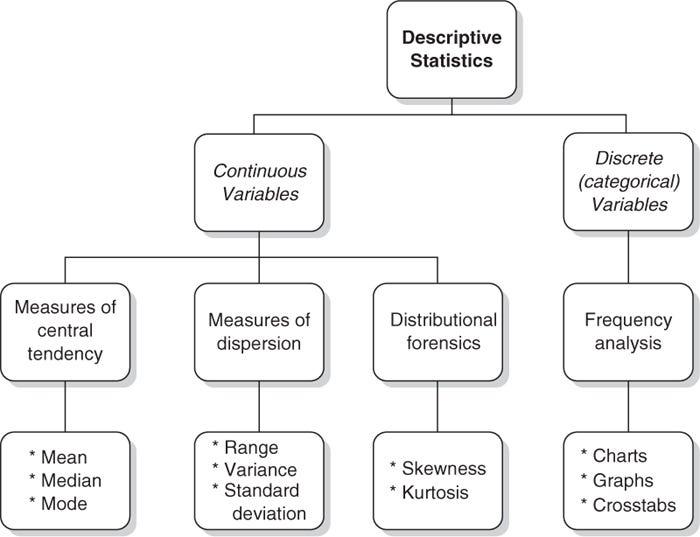
Descriptive Statistics
What is Descriptive Statistics?
Descriptive Statistics of a dataset tells you that what happened in the past. (i.e., Statistics of a company sales showing that the sales number are going down for the past 12 months).
Why we need Descriptive statistics?
Descriptive Statistics provide clear insights into the dataset. It also provides a high potential relationship between the variables and simple summaries about the sample and the measures. Descriptive statistics help you to simplify large amounts of data in a meaningful way. It reduces lots of data into a summary.

Univariate analysis:
Measures of Central Tendency:
Mean — Mean is the average or the most common value in a collection of numbers in a dataset.
Median — Median is the middle value of a sorted dataset. It is very robust from outliers.
Mode — Mode is the frequently occurring value in a dataset. It is also robust from outliers.

Measures of spread:
Range — It is the difference between the maximum and minimum values in a dataset.
IQR — Interquartile range(IQR) describes the middle 50% of values when ordered from lowest to highest.
Variance — Variance helps us to understand how the data is spread around the mean. It is denoted by sigma.
Standard deviation — Standard deviation is the square root of variance. It helps us to magnify more into the values.

Bivariate analysis:
Covariance — Covariance is a measure of how much two random variables vary together. It’s similar to variance, but where variance tells you how a single variable varies, covariance tells you how two variables vary together.
Correlation — Correlation is a measure of how things are related. It is used to test relationships between quantitative variables or categorical variables

